I am committed to open science principles and research reproducibility. I am passionate about science communication, and I enjoy building polished tools and interfaces that make complex ideas easier to explore and understand. Here are some of the projects I have worked on over the years (on the more fun/random side of things).
You can find the code repositories for my academic papers on my GitHub page.
📌 I don’t update this page much anymore. Not all my machine learning/AI projects will be here. You can find more in my Portfolio and on GitHub.
Unsupervised machine learning on illicit trade
Check out the online book Presentation GitHub repository
This project is entirely reproducible. Click on the following icon to run the code yourself (without needing to install any software at all!).
This project applies a series of unsupervised machine learning techniques to extract insights from the data on illicit trade that I developed for the United Nations.
Following the establishment of the High Level Panel on Illicit Financial Flows from Africa in 2015, the scale and severity of the problem has been well-recognized by policy-makers and NGOs. The next steps now are to move beyond scale estimates and to start understanding the nature, mechanisms, and directions of illicit trade on the continent. This project takes the first steps towards that goal.
I have utilized unsupervised machine learning techniques such as dimension reduction, clustering, and network analysis to extract meaningful insights from the data.
Strong subregional effects are apparent in illicit trade within the continent. This suggests that initiatives to combat illicit flows could be anchored within the Regional Economic Communities of the African Union, such as ECOWAS.
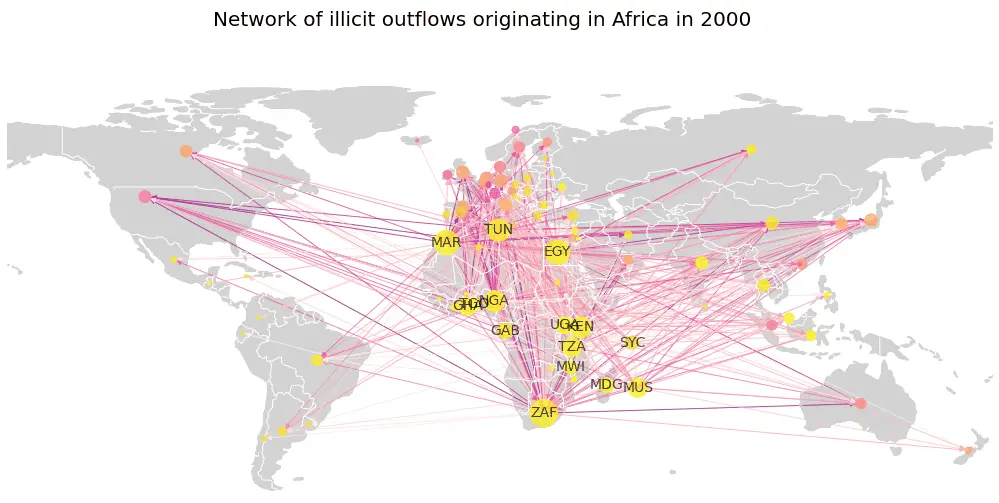
The figure below displays the evolution of the network of illicit financial outflows originating from the continent as a result of trade misinvoicing.
Genetic algorithm
Inspired by Darwinian natural selection, genetic algorithms (GA) are exercises in combinatorial optimization that can be used to solve hard optimization problems. Genetic algorithms mimic the process of evolution where only the “fittest” individuals survive over many generations. Starting from a randomly generated population, a GA applies a variety of “genetic operators” so that individuals in the population reproduce, mutate, and clone themselves in order to optimize an objective function called the “fitness function”.
I created a genetic algorithm to optimize real-valued functions and I applied it to: (1) optimizing non-convex functions and (2) image reconstruction. The algorithm is publicly available and offers 7 different genetic operators for selection, mutation, and crossover.
The algorithm performs well on non-convex functions that are typically hard to optimize: the asymmetric double claw, the Rosenbrock function, and the Rastrigin function.
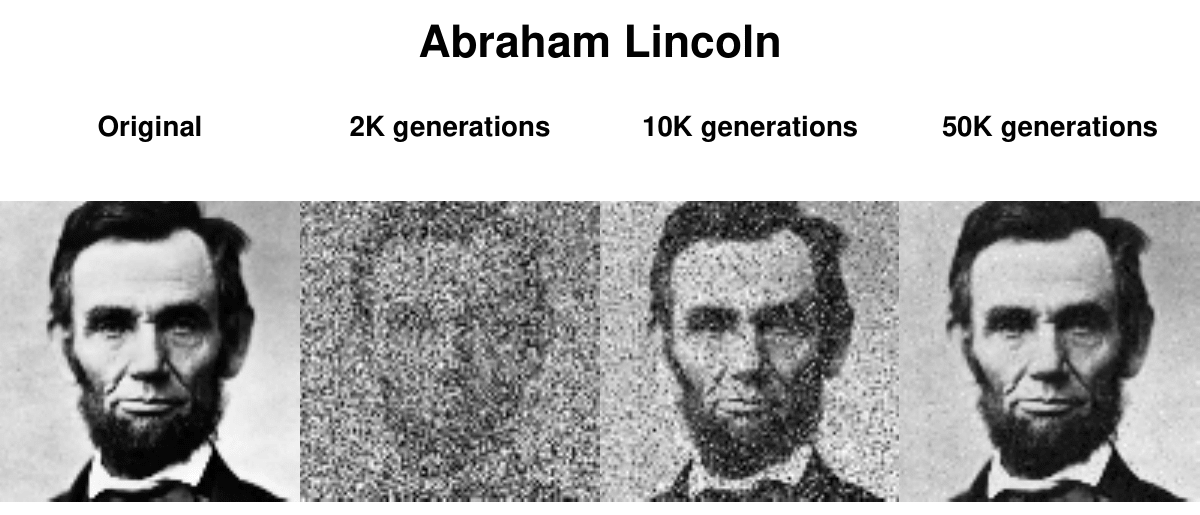
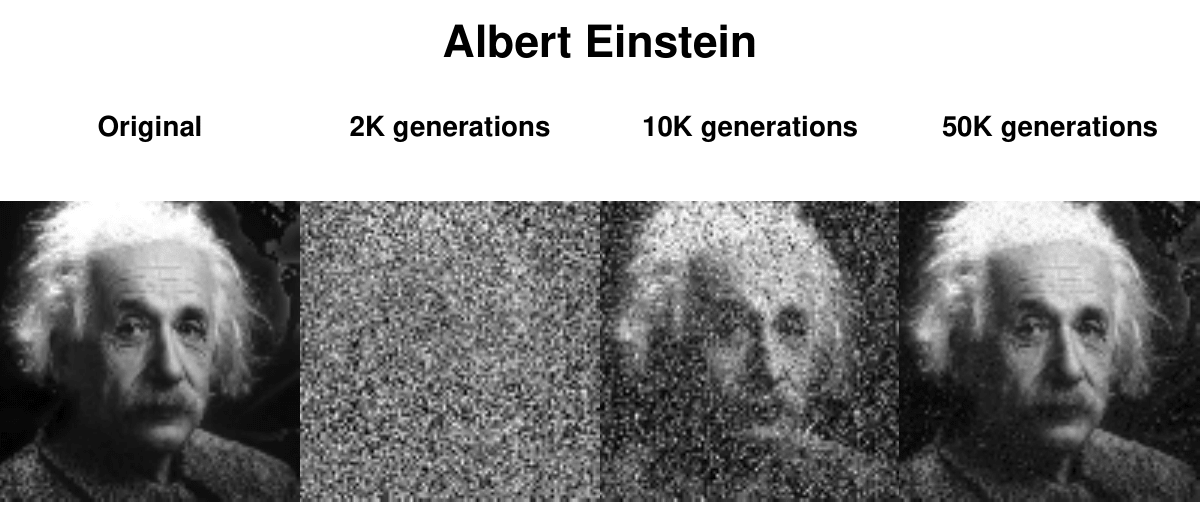
The images below show how the genetic algorithm performs for image reconstruction. Starting from randomly generated pixels, the algorithm converges after several iterations and is able to recreate the original image.
SkyShares
Check out the website GitHub repository
While I was at the Center for Global Development, I created an interactive tool that allows users to simulate the economic and environmental implications of a climate deal called SkyShares. You can find more information on SkyShares in the climate change section of my research projects page.
SkyShares is publicy available and open source. It is written in JavaScript with a Node.js back-end and a MongoDB database. SkyShares also exists as a stand-alone Excel interactive workbook (see the documentation tab of SkyShares to download SkyShares Desktop).
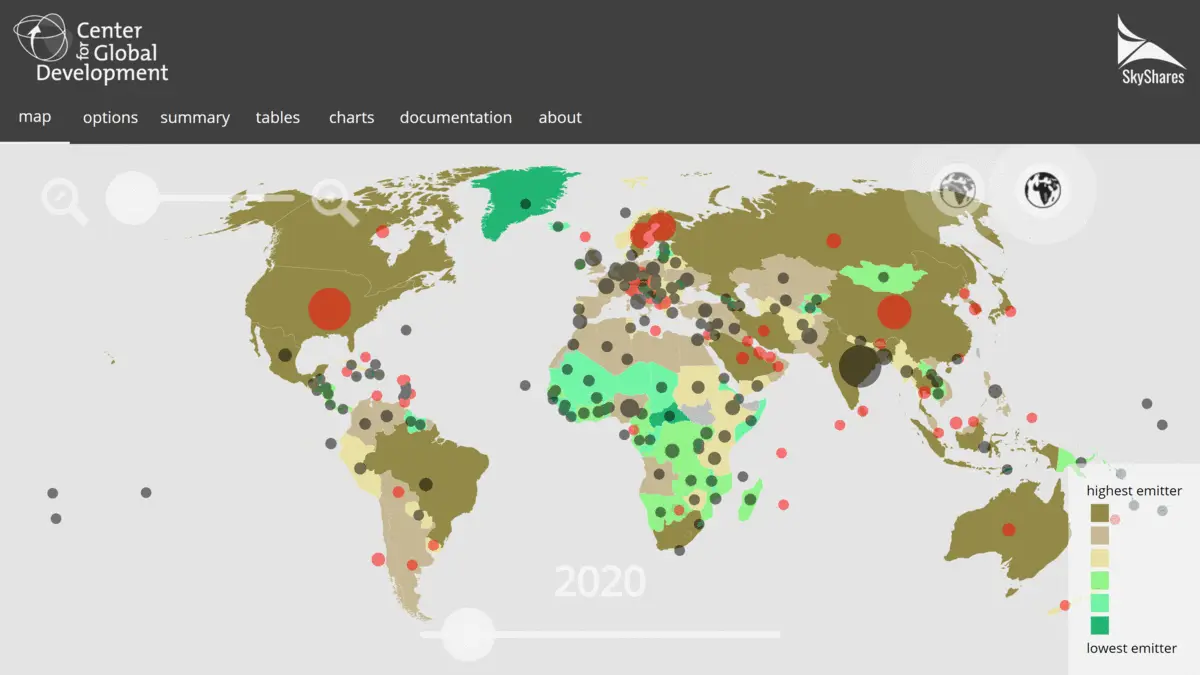
The website allows users to select which countries will participate in the climate coalition, and to choose parameters of the climate deal such as the temperature target and how much trading to allow. The website then calculates the carbon budget, financial flows, and decarbonization costs that would ensue as a result. Users can visualize the evolution of the financial flows between countries in the future.
The simulation below displays what the financial flows would be (buyers of carbon are in red, sellers of carbon are in black) as a result of a carbon budget consistent with a 2°C target, an allocation rule converging to per capita shares in 2030, and full carbon trading.
Interpolation using Bézier splines
Over 9,000 reads on ResearchGate
Have you ever wondered what smoothing algorithm Excel uses to fit smooth curves on a XY scatter? Have you ever found yourself trying to read Y values off an Excel XY scatter plot? I did.
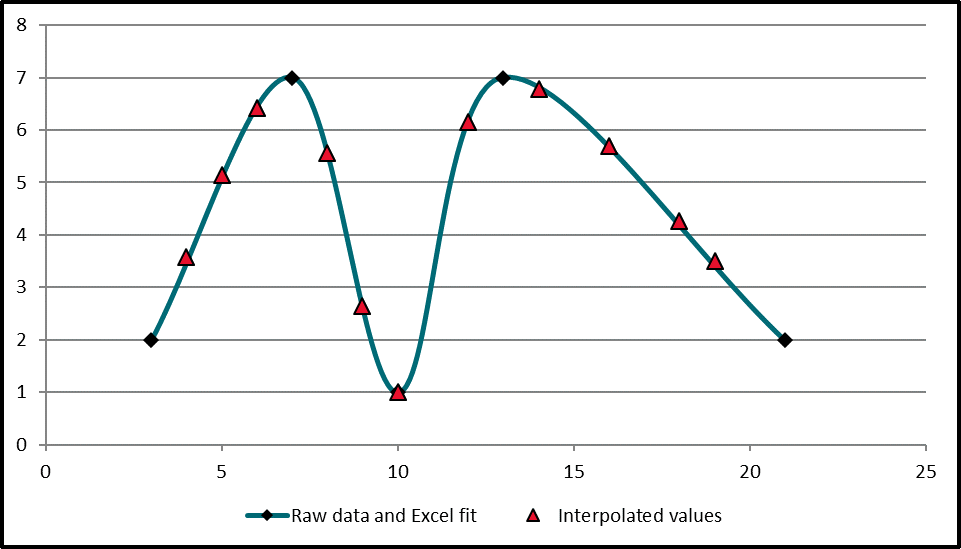
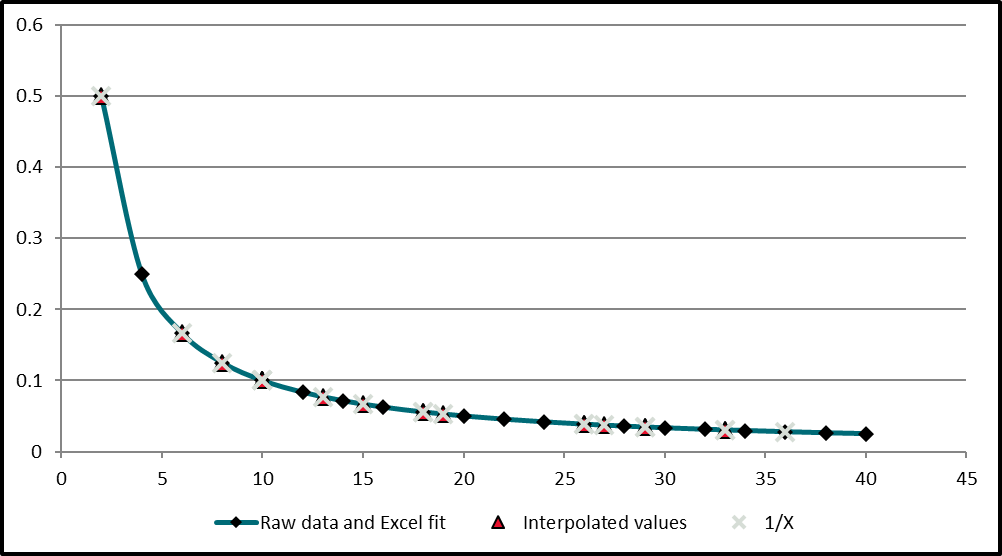
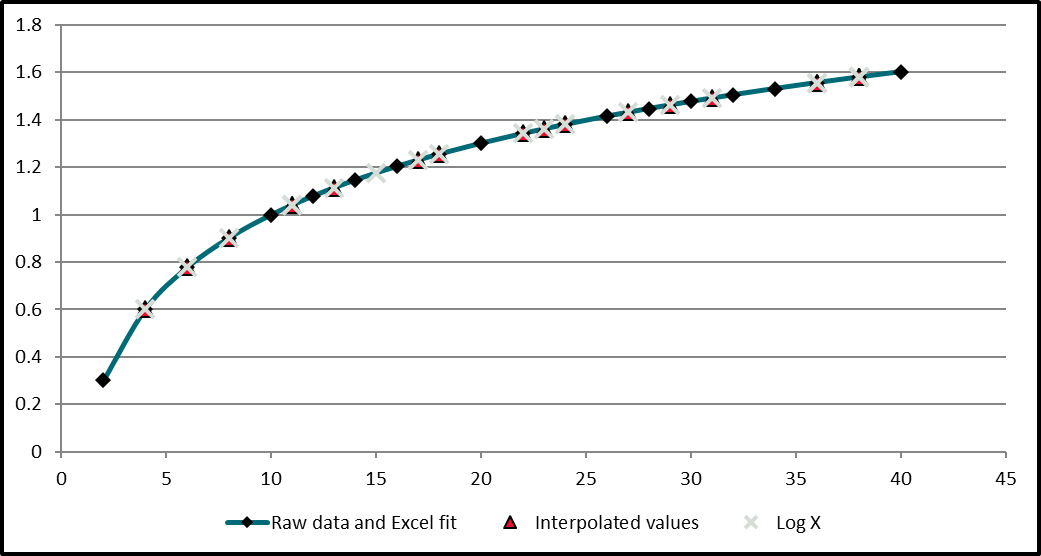
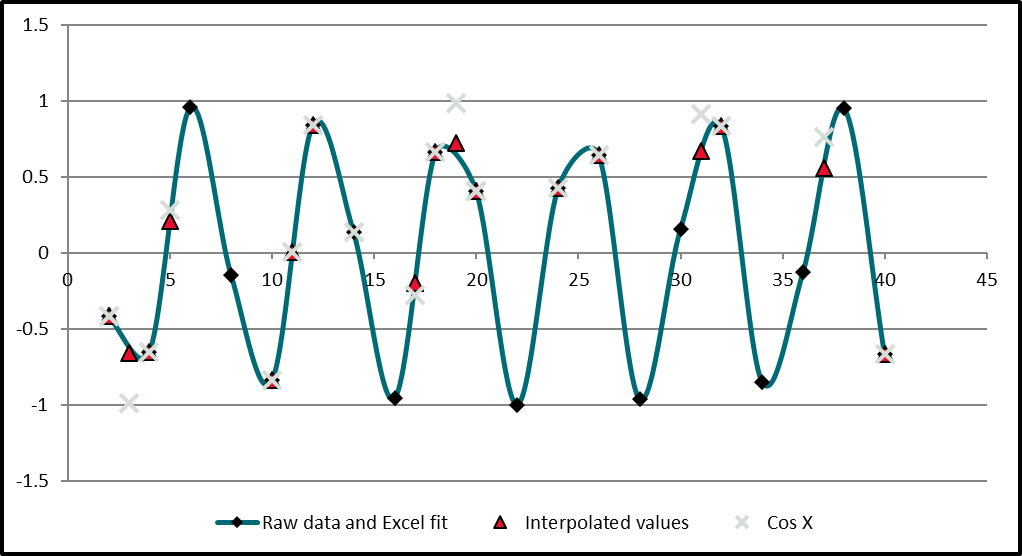
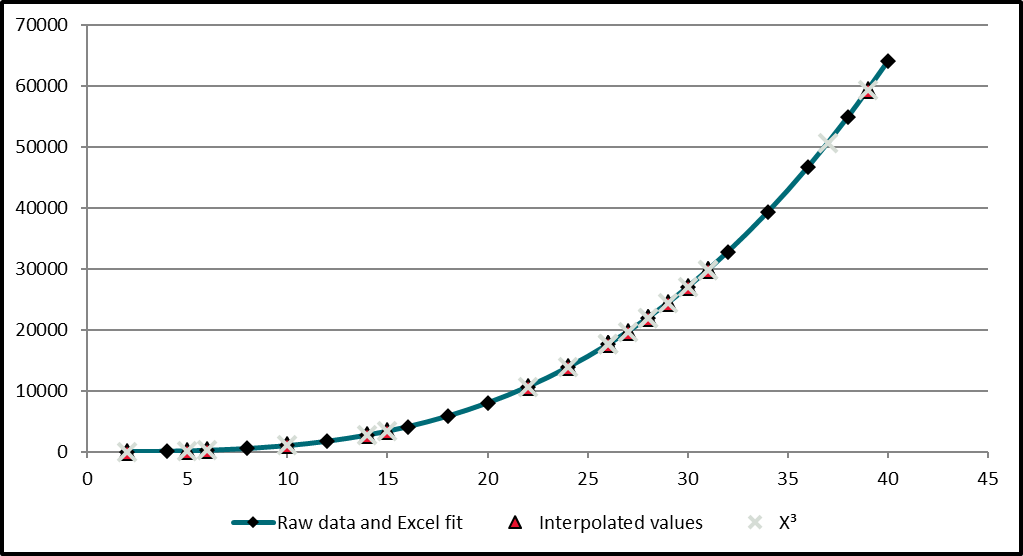
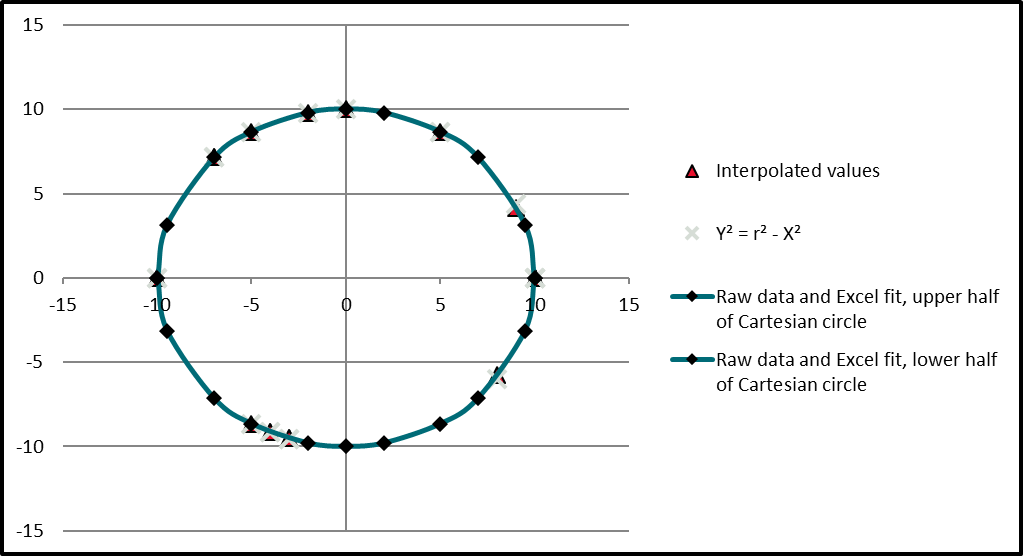
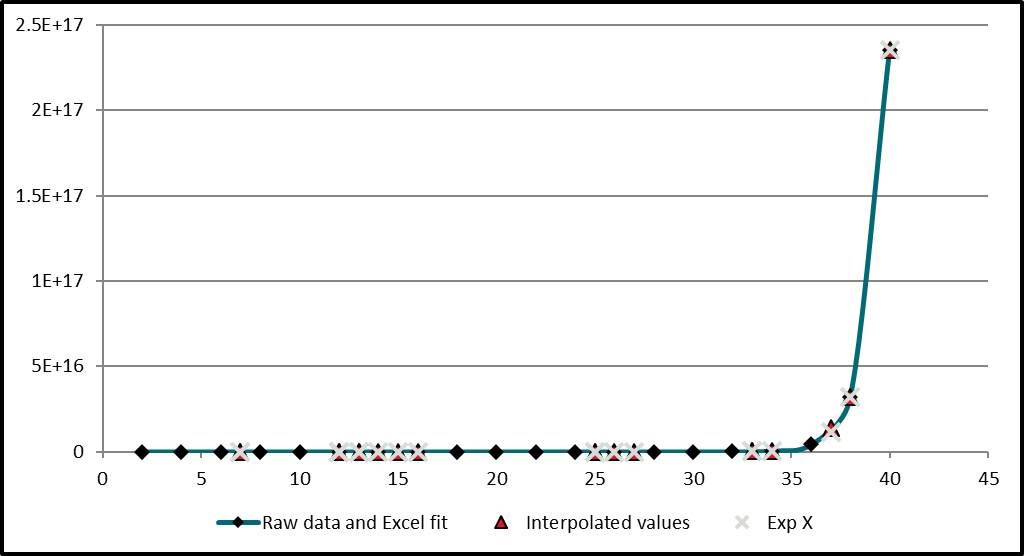
Microsoft is not transparent about how it creates the smooth fit between data points in the scatter plots. In fact, it uses a type of parametric curve called a Bézier curve; specifically, a third order Bézier curve with 4 control points. It is a type of cubic spline and avoids some of the oscillation problems which typically occur when using high degree polynomials for interpolation.
I created an Excel add-in to interpolate along Excel’s smooth line scatter plots. The add-in also comes in with a function to linearly interpolate and extrapolate.
The gallery below showcases the performance of the Bézier spline interpolator on a variety of test functions.
Scraping daily COVID data
Check out the live data GitHub repository
This project scraped the daily reopening metrics for the county of Santa Barbara from the California Department of Public Health. The website was automatically scraped every day.
